P/E Ratios Offer Multiple Perspectives on Value
By Mark FisselPosted on November 30th, 2021
Many factors go into decisions on buying or selling shares of a particular stock, but the price/earnings (P/E) ratio can be a helpful starting point for evaluating whether a company’s stock is under- or overpriced. The P/E ratio is calculated by dividing a stock’s current price per share by the company’s earnings per share over a 12-month period. This ratio quantifies what investors may be willing to pay for one dollar of earnings.
For example, a P/E of 20 means an investor would pay $20 for every $1 the company earns over the 12-month period. By this standard, a stock with a P/E of 25 could be considered more “expensive” than a stock with a P/E of 20, regardless of the share price. A higher multiple also indicates that investors may expect higher growth from the company compared to the overall market.
Past and Future
There are two main types of P/E ratios. Trailing P/E is based on the company’s actual reported earnings per share for the previous 12 months. Because earnings are reported quarterly, that part of the equation will generally remain the same for the entire three-month period, but the stock price may change every trading day.
Forward P/E is based on the company’s projected earnings over the next 12 months. The forward P/E can also fluctuate with stock prices and as earnings projections are updated.
Trailing P/E is generally considered a more objective metric than forward P/E, because earnings projections are essentially opinions that may not turn out to be accurate. However, some investors prefer to focus on forward P/E, because a company’s past performance may have little to do with its future prospects.
Use Ratios Wisely
Knowing a company’s P/E ratio may provide some insight, but only if you use it to make appropriate comparisons. It is generally more meaningful to compare ratios of companies in the same industry or one company against the industry average. This is because P/E ratios can vary widely among industries and may also change for an entire industry as it faces challenges or goes in or out of favor with investors.
You might also compare a company’s current and past performance, but keep in mind that P/E ratios typically rise and fall with stock prices; if prices rise and earnings stay about the same, P/E ratios increase, and vice versa. So an increase or decrease in a company’s P/E ratio that moves with the broader market may not tell you much about the company’s performance.
On the other hand, a substantial change in a company’s P/E ratio that is not in step with the market could be caused by an unexpected increase or decrease in reported or projected earnings, or by a shift in investor confidence in the company. Different Industries, Different Ratios
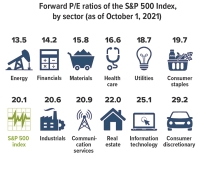
Source: Broadridge; FactSet, October 1, 2021. The S&P 500 is an unmanaged group of securities that is considered to be representative of the stock market in general. The performance of an unmanaged index is not indicative of the performance of any specific investment. Individuals cannot invest directly in an index. A portfolio invested only in companies in a particular industry or market sector may not be sufficiently diversified and could be subject to a significant level of volatility and risk.
As of October 1, 2021, the average forward 12-month P/E ratio for stocks listed in the S&P 500 was 20.1. This is significantly higher than the five-year average of 18.3 and the 10-year average of 16.4.1 But that may or may not mean that the market as a whole is overpriced.
It’s possible that earnings projections could be off by a wide margin — and that P/E ratios could be more difficult for investors to interpret — until the disruptive effects of the pandemic are well behind us. In fact, it’s generally a good idea to consider additional types of data, such as dividends and longer-term growth expectations, when evaluating potential stock investments.
The return and principal value of stocks fluctuate with changes in market conditions. Shares, when sold, may be worth more or less than their original cost.
1) FactSet, October 1, 2021